 |
Zakładka z wyszukiwarką danych komponentów |
|
|
Zakładka z wyszukiwarką danych komponentów |
|
The question interval is too short.
Please try again in a few seconds.

Hello, Please ask a question about NJM320A Datasheet
# Example questions:
➢ How does the 'low-level output voltage' change with increasing 'output sink current,' as described in the relevant graph?
➢ ' what key variable(s) are plotted against the maximum output voltage in these graphs?
➢ What is the range of ambient operating temperatures (ta) for which the device’s performance is characterized?
| Part No. | NJM320A |
| Manufacturer | NJRC |
| Size | 751 Kbytes |
| Pages | 11 pages |
| Description | Low power single channel OP-Amp |


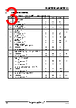

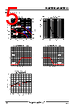


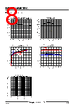


This is a complex set of images depicting technical specifications and characteristic curves for an operational amplifier (likely a high-speed op-amp, given the terminology and graphs). Here's a breakdown, organized by section and with explanations where helpful. This analysis is based solely on the text and graph labels visible in the provided image.
1. General/Title Block
️· "Maximum Output Voltage vs. Load Resistance": This is a common test for op-amps. It shows how the output voltage changes as the load (connected circuit) changes its resistance.
️· "Maximum Output Voltage vs. Output Current": This tests for the voltage capability of the Op Amp under different current outputs.
2. Ta (Ambient Temperature) Specifications
️· A key element throughout is "Ta" which stands for Ambient Temperature. Multiple Ta values (e.g., Ta=5ºC, Ta=125ºC, Ta=-40ºC) are listed, each representing a different temperature the op-amp is specified to operate within.
️· There's a recurring listing of "Ta= -40ºC, 25ºC, 125ºC". This highlights the operational temperature range.
️· A list of values shows how specifications might change with temperature.
3. Graphs/Characteristic Curves
These are the most technically informative parts. I'm interpreting them based on the axis labels and titles.
️· "Maximum Output Voltage vs. Load Resistance":
- X-axis: Load Resistance (in Ohms – ranges vary, but include values like 10, 100, 1k, 10k, 100k).
- Y-axis: Output Voltage (in Volts – ranges vary, likely from 0V to a positive voltage like 5V or 10V).
- Multiple curves on the graph likely represent how this relationship changes with different ambient temperatures (Ta).
️· "Maximum Output Voltage vs. Output Current":
- X-axis: Output Current (in mA – ranges like 10, 100, 1000, 10000)
- Y-axis: Output Voltage (likely in Volts)
- Multiple curves show how the voltage-current characteristic shifts with different temperatures.
️· "Low-level Output Voltage vs. Output Sink Current":
- X-axis: Output Sink Current (in mA)
- Y-axis: Output Voltage (likely in Volts)
️· "Maximum Output Voltage vs. Load Resistance" - Displays a graph of max output voltage as a function of load resistance.
️· "Maximum Output Voltage vs. Output Current" - Displays a graph of max output voltage as a function of the output current
️· "Low-level Output Voltage vs. Output Sink Current" - Shows the minimum output voltage against sink current.
4. Electrical Characteristics Table
This likely contains numerical data about the op-amp's performance, such as:
️· Supply Voltage: The range of voltages it can operate with.
️· Input Bias Current: The small current flowing into the input terminals.
This is a complex set of images depicting technical specifications and characteristic curves for an operational amplifier (likely a high-speed op-amp, given the terminology and graphs). Here's a breakdown, organized by section and with explanations where helpful. This analysis is based solely on the text and graph labels visible in the provided image.
1. General/Title Block
️· "Maximum Output Voltage vs. Load Resistance": This is a common test for op-amps. It shows how the output voltage changes as the load (connected circuit) changes its resistance.
️· "Maximum Output Voltage vs. Output Current": This tests for the voltage capability of the Op Amp under different current outputs.
2. Ta (Ambient Temperature) Specifications
️· A key element throughout is "Ta" which stands for Ambient Temperature. Multiple Ta values (e.g., Ta=5ºC, Ta=125ºC, Ta=-40ºC) are listed, each representing a different temperature the op-amp is specified to operate within.
️· There's a recurring listing of "Ta= -40ºC, 25ºC, 125ºC". This highlights the operational temperature range.
️· A list of values shows how specifications might change with temperature.
3. Graphs/Characteristic Curves
These are the most technically informative parts. I'm interpreting them based on the axis labels and titles.
️· "Maximum Output Voltage vs. Load Resistance":
- X-axis: Load Resistance (in Ohms – ranges vary, but include values like 10, 100, 1k, 10k, 100k).
- Y-axis: Output Voltage (in Volts – ranges vary, likely from 0V to a positive voltage like 5V or 10V).
- Multiple curves on the graph likely represent how this relationship changes with different ambient temperatures (Ta).
️· "Maximum Output Voltage vs. Output Current":
- X-axis: Output Current (in mA – ranges like 10, 100, 1000, 10000)
- Y-axis: Output Voltage (likely in Volts)
- Multiple curves show how the voltage-current characteristic shifts with different temperatures.
️· "Low-level Output Voltage vs. Output Sink Current":
- X-axis: Output Sink Current (in mA)
- Y-axis: Output Voltage (likely in Volts)
️· "Maximum Output Voltage vs. Load Resistance" - Displays a graph of max output voltage as a function of load resistance.
️· "Maximum Output Voltage vs. Output Current" - Displays a graph of max output voltage as a function of the output current
️· "Low-level Output Voltage vs. Output Sink Current" - Shows the minimum output voltage against sink current.
4. Electrical Characteristics Table
This likely contains numerical data about the op-amp's performance, such as:
️· Supply Voltage: The range of voltages it can operate with.
️· Input Bias Current: The small current flowing into the input terminals.
| Part No. | NJM320A |
| Manufacturer | NJRC |
| Size | 751 Kbytes |
| Pages | 11 pages |
| Description | Low power single channel OP-Amp |
| Czy Alldatasheet okazała się pomocna? [ DONATE ] |
O Alldatasheet | Reklama | Kontakt | Polityka prywatności | Link do karty katalogowej | Linki | Lista producentów All Rights Reserved©Alldatasheet.com |
| Russian : Alldatasheetru.com | Korean : Alldatasheet.co.kr | Spanish : Alldatasheet.es | French : Alldatasheet.fr | Italian : Alldatasheetit.com Portuguese : Alldatasheetpt.com | Polish : Alldatasheet.pl | Vietnamese : Alldatasheet.vn Indian : Alldatasheet.in | Mexican : Alldatasheet.com.mx | British : Alldatasheet.co.uk | New Zealand : Alldatasheet.co.nz |
|
Family Site : ic2ic.com |
icmetro.com |
 Polish ▼
  English
 Chinese
 German
 Japanese
 Russian
 Korean
 Spanish
 French
 Italian
 Portuguese
 Vietnamese
 Indian
 Mexican
 British
 New Zealand